Basic Troubleshooting
Basic troubleshooting includes checking the status of all three Brainspace servers, reviewing logs, monitoring the build process, and reviewing the results of the build to identify and to resolve common problems when using Brainspace.
Note
To view a list of error codes, see Error Resolution Troubleshooting Table.
Verify Server Status
The first step in basic troubleshooting is to verify that each Brainspace server is in Active status, that each server has sufficient disk space and memory, and that the Brainspace license has not expired or exceeded capacity.
To verify server status:
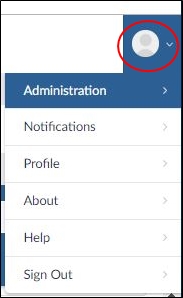
In the user drop-down menu, click Administration:
The Datasets screen will open.
In the Datasets screen, Click the Services button:
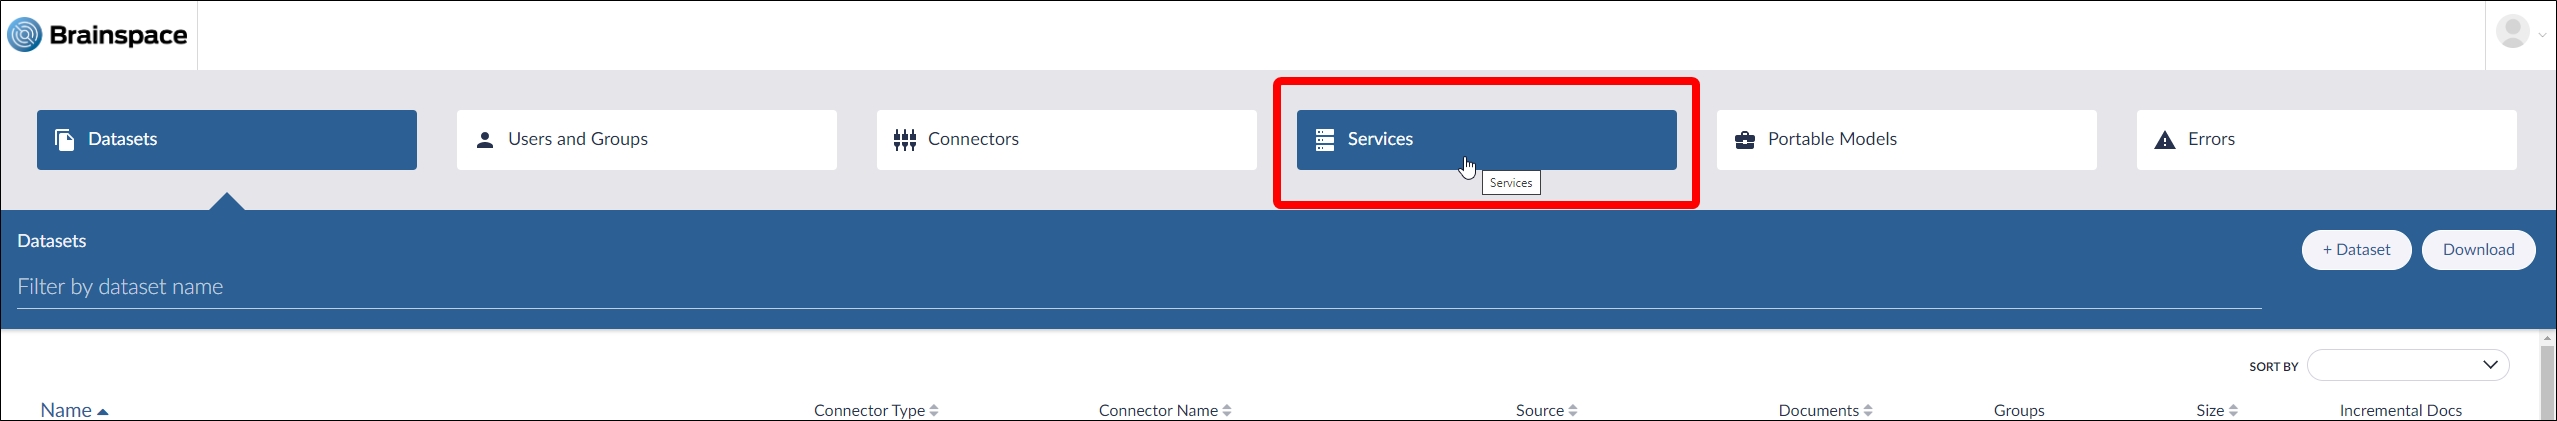
The Services screen will open.
On the Services screen, verify that the three Brainspace servers are active:
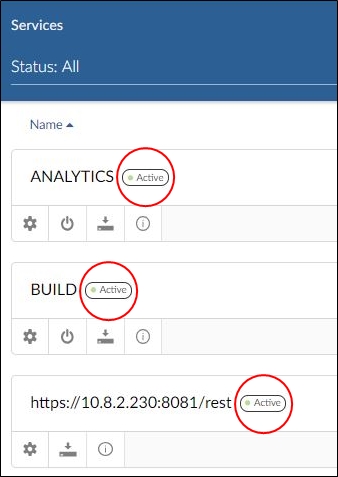
If a server is not in Active status, check server and data volume health (both /data and /localdata), verify that required services are running (postgres, Tomcat on the Application server, On-Demand Analytics server, and others), and verify that the Analytics and On-Demand servers are accessible from the Application server (port 1604).
Click the Server Information icon, and then verify that a green check-mark displays next to Disk, License, and JVM Memory:


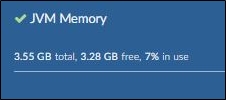
After verifying server status, verify connector configuration.
Verify Connector Configuration
After verifying server status, verify connector configuration and ability to access the data source.
To verify connector configuration:
In the user drop-down menu, click Administration:
The Datasets screen will open.
Click the Connectors button:

The Connectors screen will open.
In the Connectors screen, click the Update Connector icon in the first dataset in the list:

The Connector Name dialog will open.
Verify that the external data source is online and available (correct service running, correct port, network access, correct account permissions, etc.).
Click the Test Connector button. If the connector is configured correctly, a validation message will display:

If the connector is not configured correctly, a failure message will display:

Note
The following links provide information about specific connector requirements:
After verifying connector configuration for all datasets, review the Error Log.
Review the Error Log
After verifying connector configuration, review the Error Log for any recent errors related to problems you are experiencing.
To review the Error Log:
In the user drop-down menu, click Administration:
The Datasets screen will open.
Click the Errors button:
The Error Log screen will open.
Click an error in the list, and then review the error details:

Note
You can also type a search word in the Quick Search text box, and then select a date range using the Select a start date and Select end date drop-down calendars:
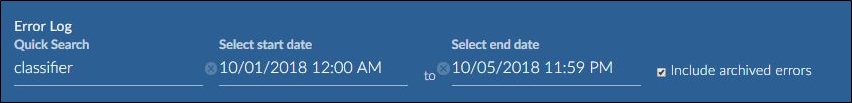
To include archived errors in the search results, click the Include archived errors check box:

The Error Log will refresh and display applicable errors.
After reviewing the Error Log, download and review the Brainspace Log.
Download and Review the Brainspace Log
After reviewing the Error Log, download and review the Brainspace Log.
To download and review the Brainspace Log:
In the user drop-down menu, click Administration:
The Datasets screen will open.
In the Datasets screen, Click the Services button:
The Services screen will open.
Click the Application server's Download icon:
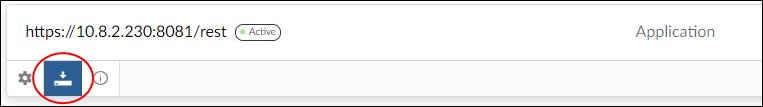
The Application server Report list will open.
Locate brainspace.log, and then click the Download button:
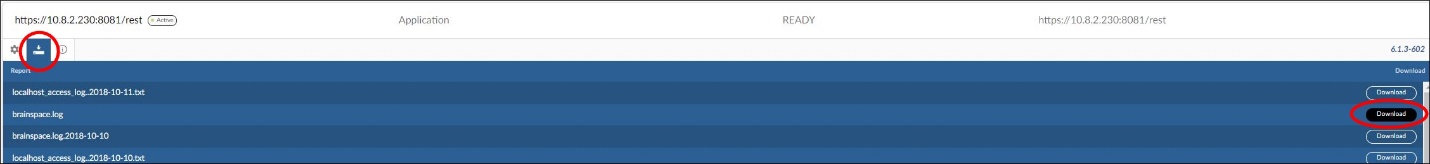
The Brainspace Log text file will download to your local machine.
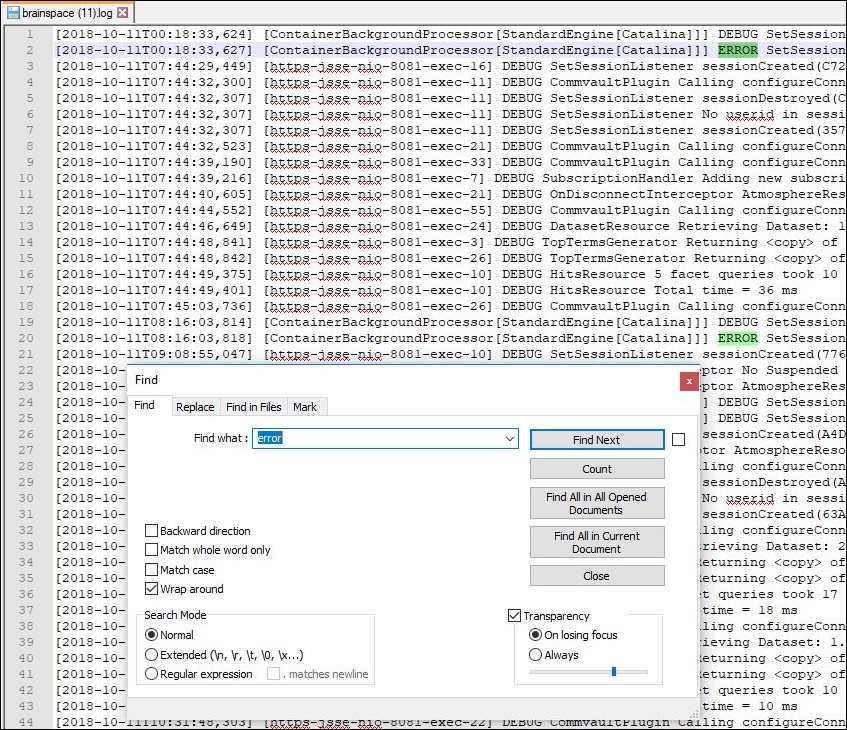
Open the text file, and then search the Brainspace Log for the word "ERROR," generally in all-caps, and a timestamp that corresponds to the time that the problem was encountered:
Note
Look for brainspace.log.[date], such as brainspace.log.2018-10-10, if the error was experienced during a prior day. A new Brainspace log file is created each day (typically at midnight server time), and the prior days are saved with their dates.
Review the ERROR and first “Caused by” instance following the error to determine the root cause.
Note
If the error indicates something infrastructure related (for example, cannot write to a file or to a disk could indicate that the drive volume is full or unreachable) or a data problem (for example, cannot recognize ingested data format), escalate the issue within your organization.
Using the error keyword(s) from the Brainspace log, search the Brainspace Error Resolution Troubleshooting Table to find an explanation of and recommended resolution for the error.
If you cannot determine the root cause from the Error Log or the Brainspace Log, save the Brainspace Log and contact Brainspace Support for assistance.
Download and Review the Build Log
If an error or build failure occurs after successful ingestion and during a build, download and review the Build Log. The Build Log provides dataset-specific build information.
To download and review the Build Log:
In the user drop-down menu, click Administration:
The Datasets screen will open.
Choose a dataset, and then click the Download Reports icon:

Locate Build Log, and then click the Download button:

The Build Log text file will download to your local machine.
Open the text file, and then review the Build Log for errors and the build summary in the last few lines of the Build Log.
After downloading and reviewing the Build Log, download and review the Analysis (Analytics) Server Log if the Build Log does not indicated a root cause or if the root cause indicates a problem with the Analysis (Analytics) server.
Download and Review the Analysis (Analytics) Server Log
After downloading and reviewing the Build Log, download and review the Analysis (Analytics) Server Log if no root cause was found in the Build Log or if the root cause indicates a problem with the Analytics server.
Note
The Analysis Server Log shows local errors on the Analytics server only; however, these local errors are the same details shown in the Brainspace Log if the application server retained connectivity with the Analytics server throughout the build.
To download and review the Analysis (Analytics) Server Log:
In the user drop-down menu, click Administration:
The Datasets screen will open.
In the Datasets screen, click the Services button:
The Services screen will open.
Click the Analytics server's Download logs icon:
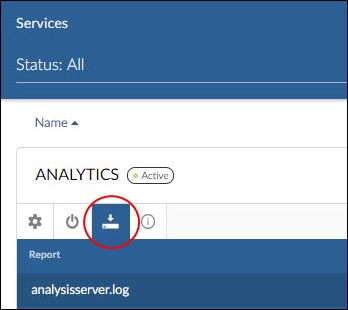
The Analytics server's Report list will open.
Note
This report is also available for the Build server.
Locate analysisserver.log, and then click the Download button.

The Analysis Server Log text file will download to your local machine.
Open the text file, and then review the Analysis Server Log for errors around the time that the issue was encountered.